Geocomputation with R competition: book cover for the 2nd edition
This is a guest blog post written by Benjamin Nowak. He is the winner of the Geocomputation with R book cover competition for the second edition of the book. Congratulations!
One page, many things to show
Like Marco Sciaini, the creator of the cover of the previous edition, I started with the idea that seemed most logical to illustrate the cover of Geocomputation with R: illustrate various geocomputation and mapping techniques on the front page. The hexagons, reminiscent of R packages, were a good idea of Marco’s, but I had to come up with something new.
The cover competition arrived approximately at the same time as the release of Alberto Cairo’s The Art of Insight, and I must confess that the beautiful tryptic imagined by Nadieh Bremer for the cover first gave me the idea of trying out a layout with three different maps (one on top of the other). But it was just copying someone else.
The next idea then came to me quickly, as it fits well with the way graphics and maps are added as different layers in the same ggplot() object: adding different small maps on one big map.
A tribute to useful ressources
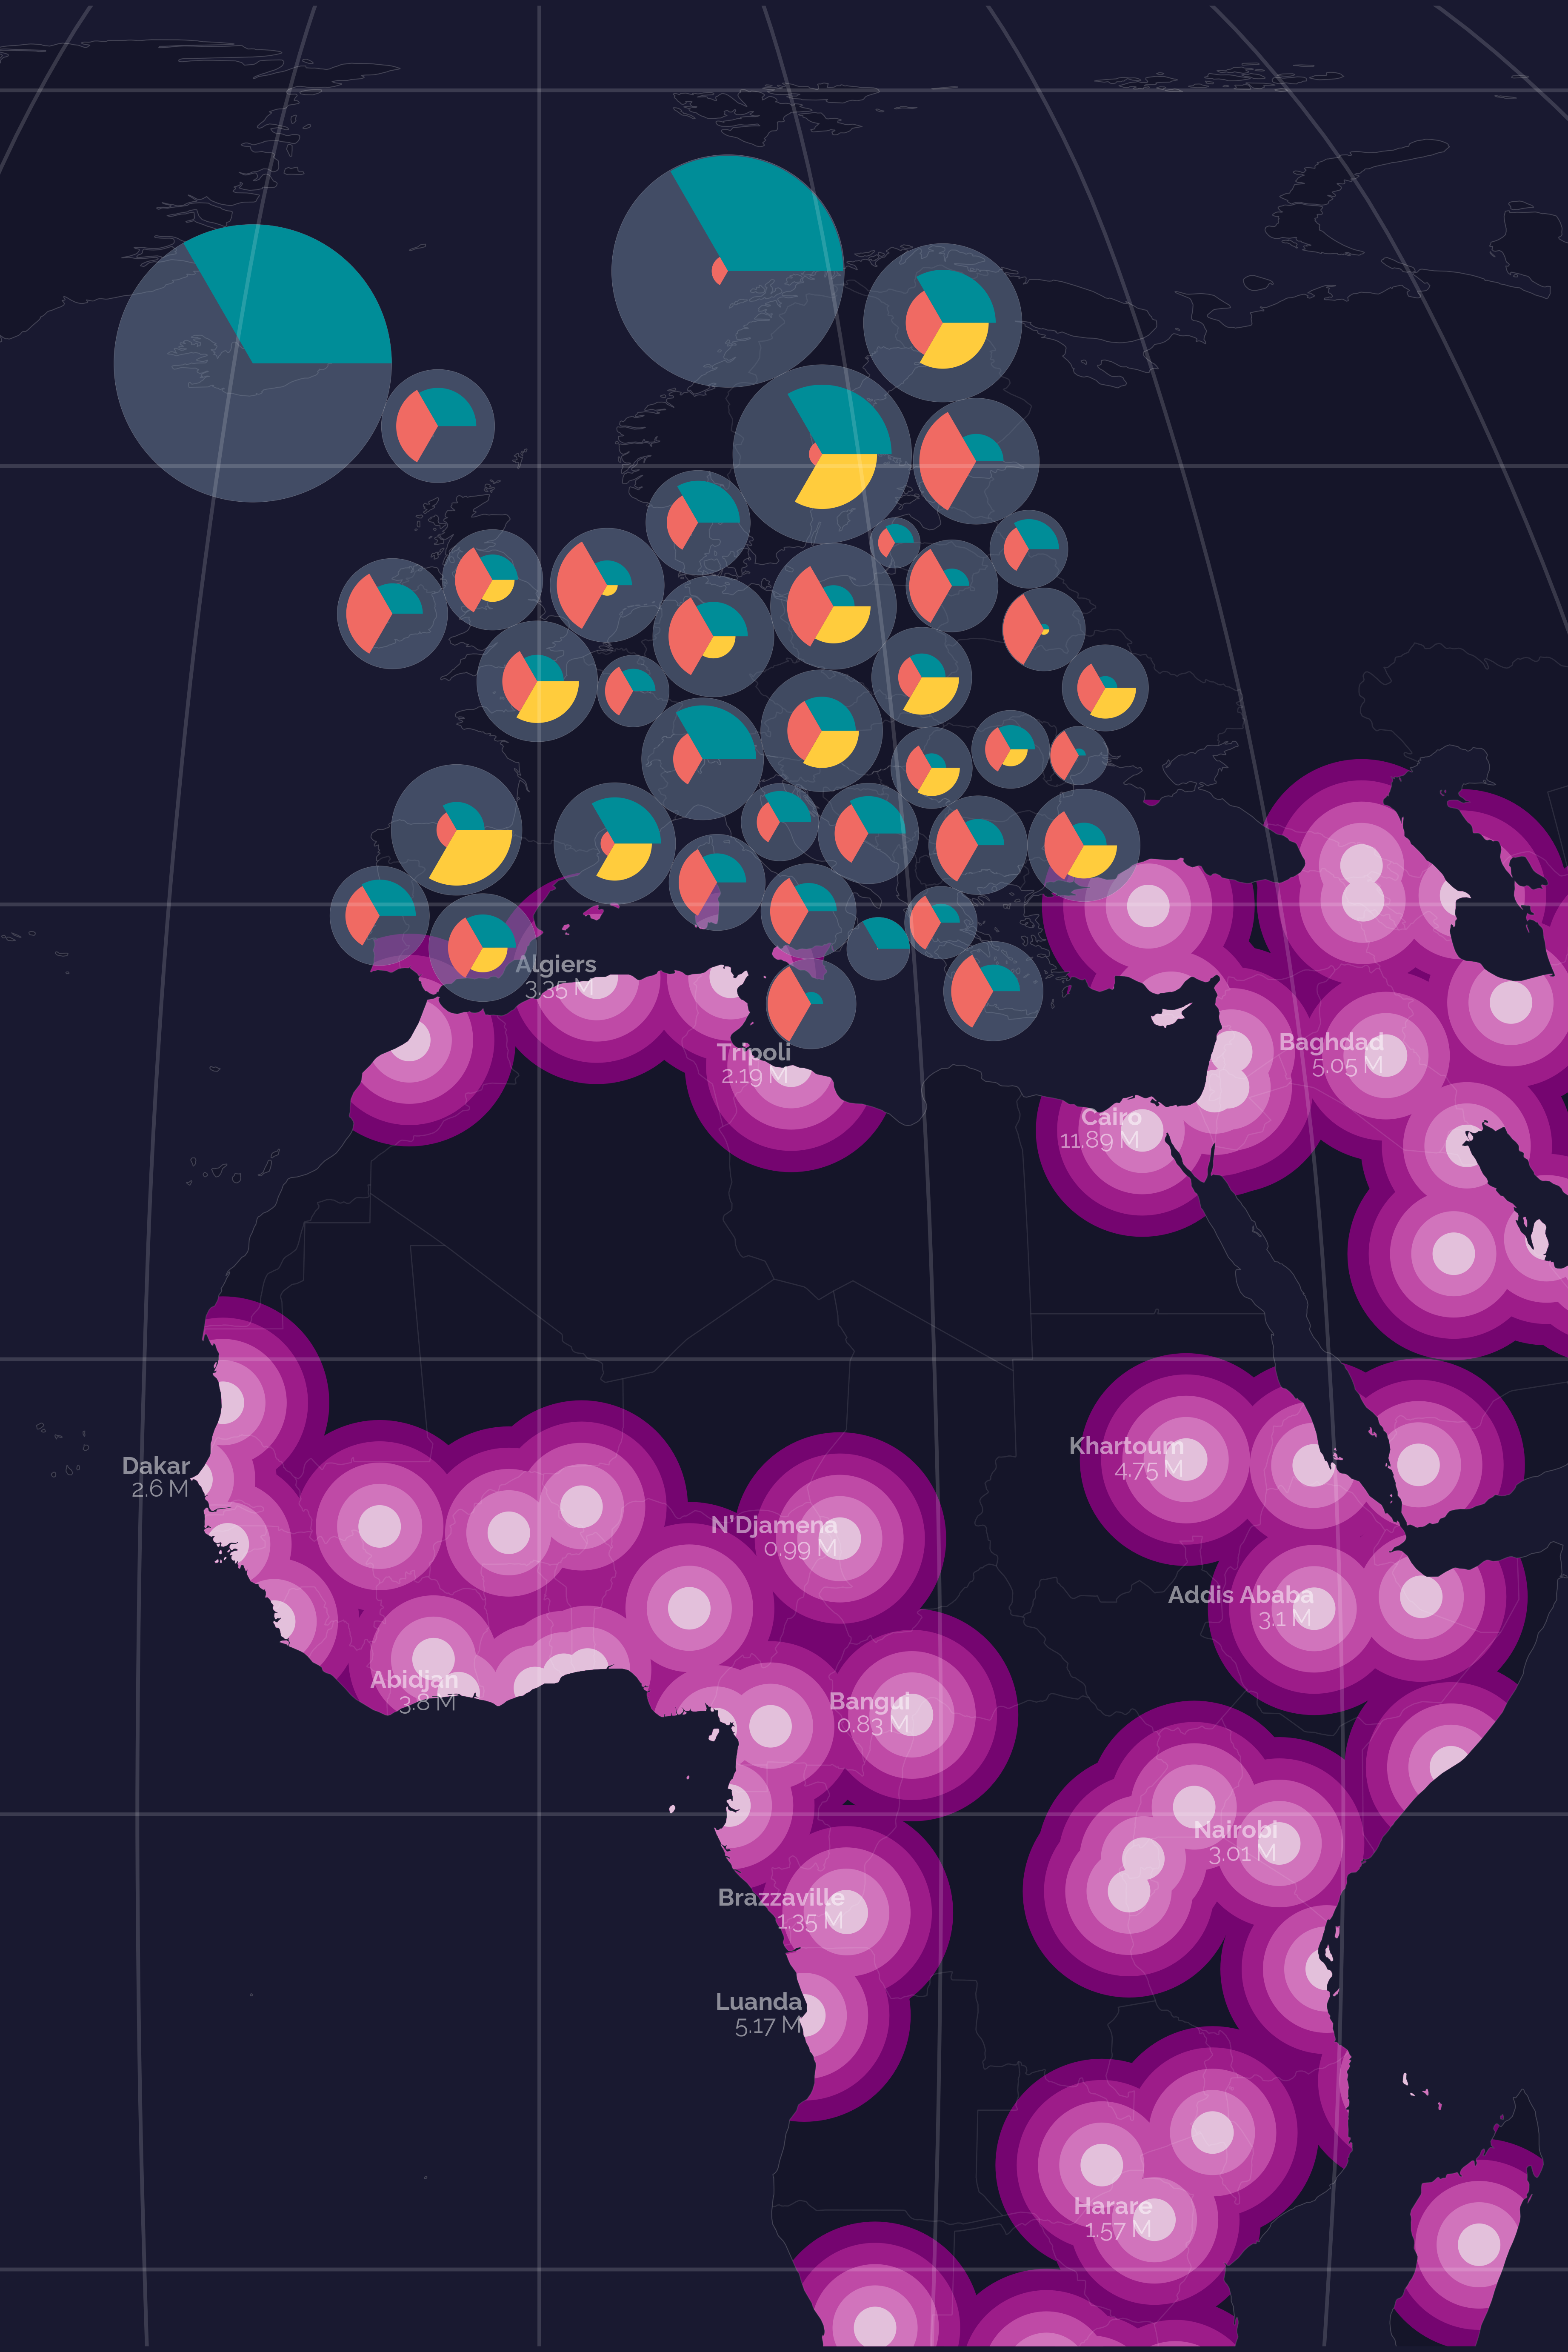
Another idea I had with this cover was to highlight useful resources for the R community. For this purpose, I used a Tidy Tuesday dataset on energy production by country for the Dorling cartogram that covered Europe in my first proposal.
Another very important resource for me are the palette color packages, which save me so much time for my dataviz creation! So for this proposal I used Blake Robert Mills’ MoMAColors packages and scico from Fabio Crameri and Thomas Lin Pedersen.
This led me to the following proposal:

Almost there…
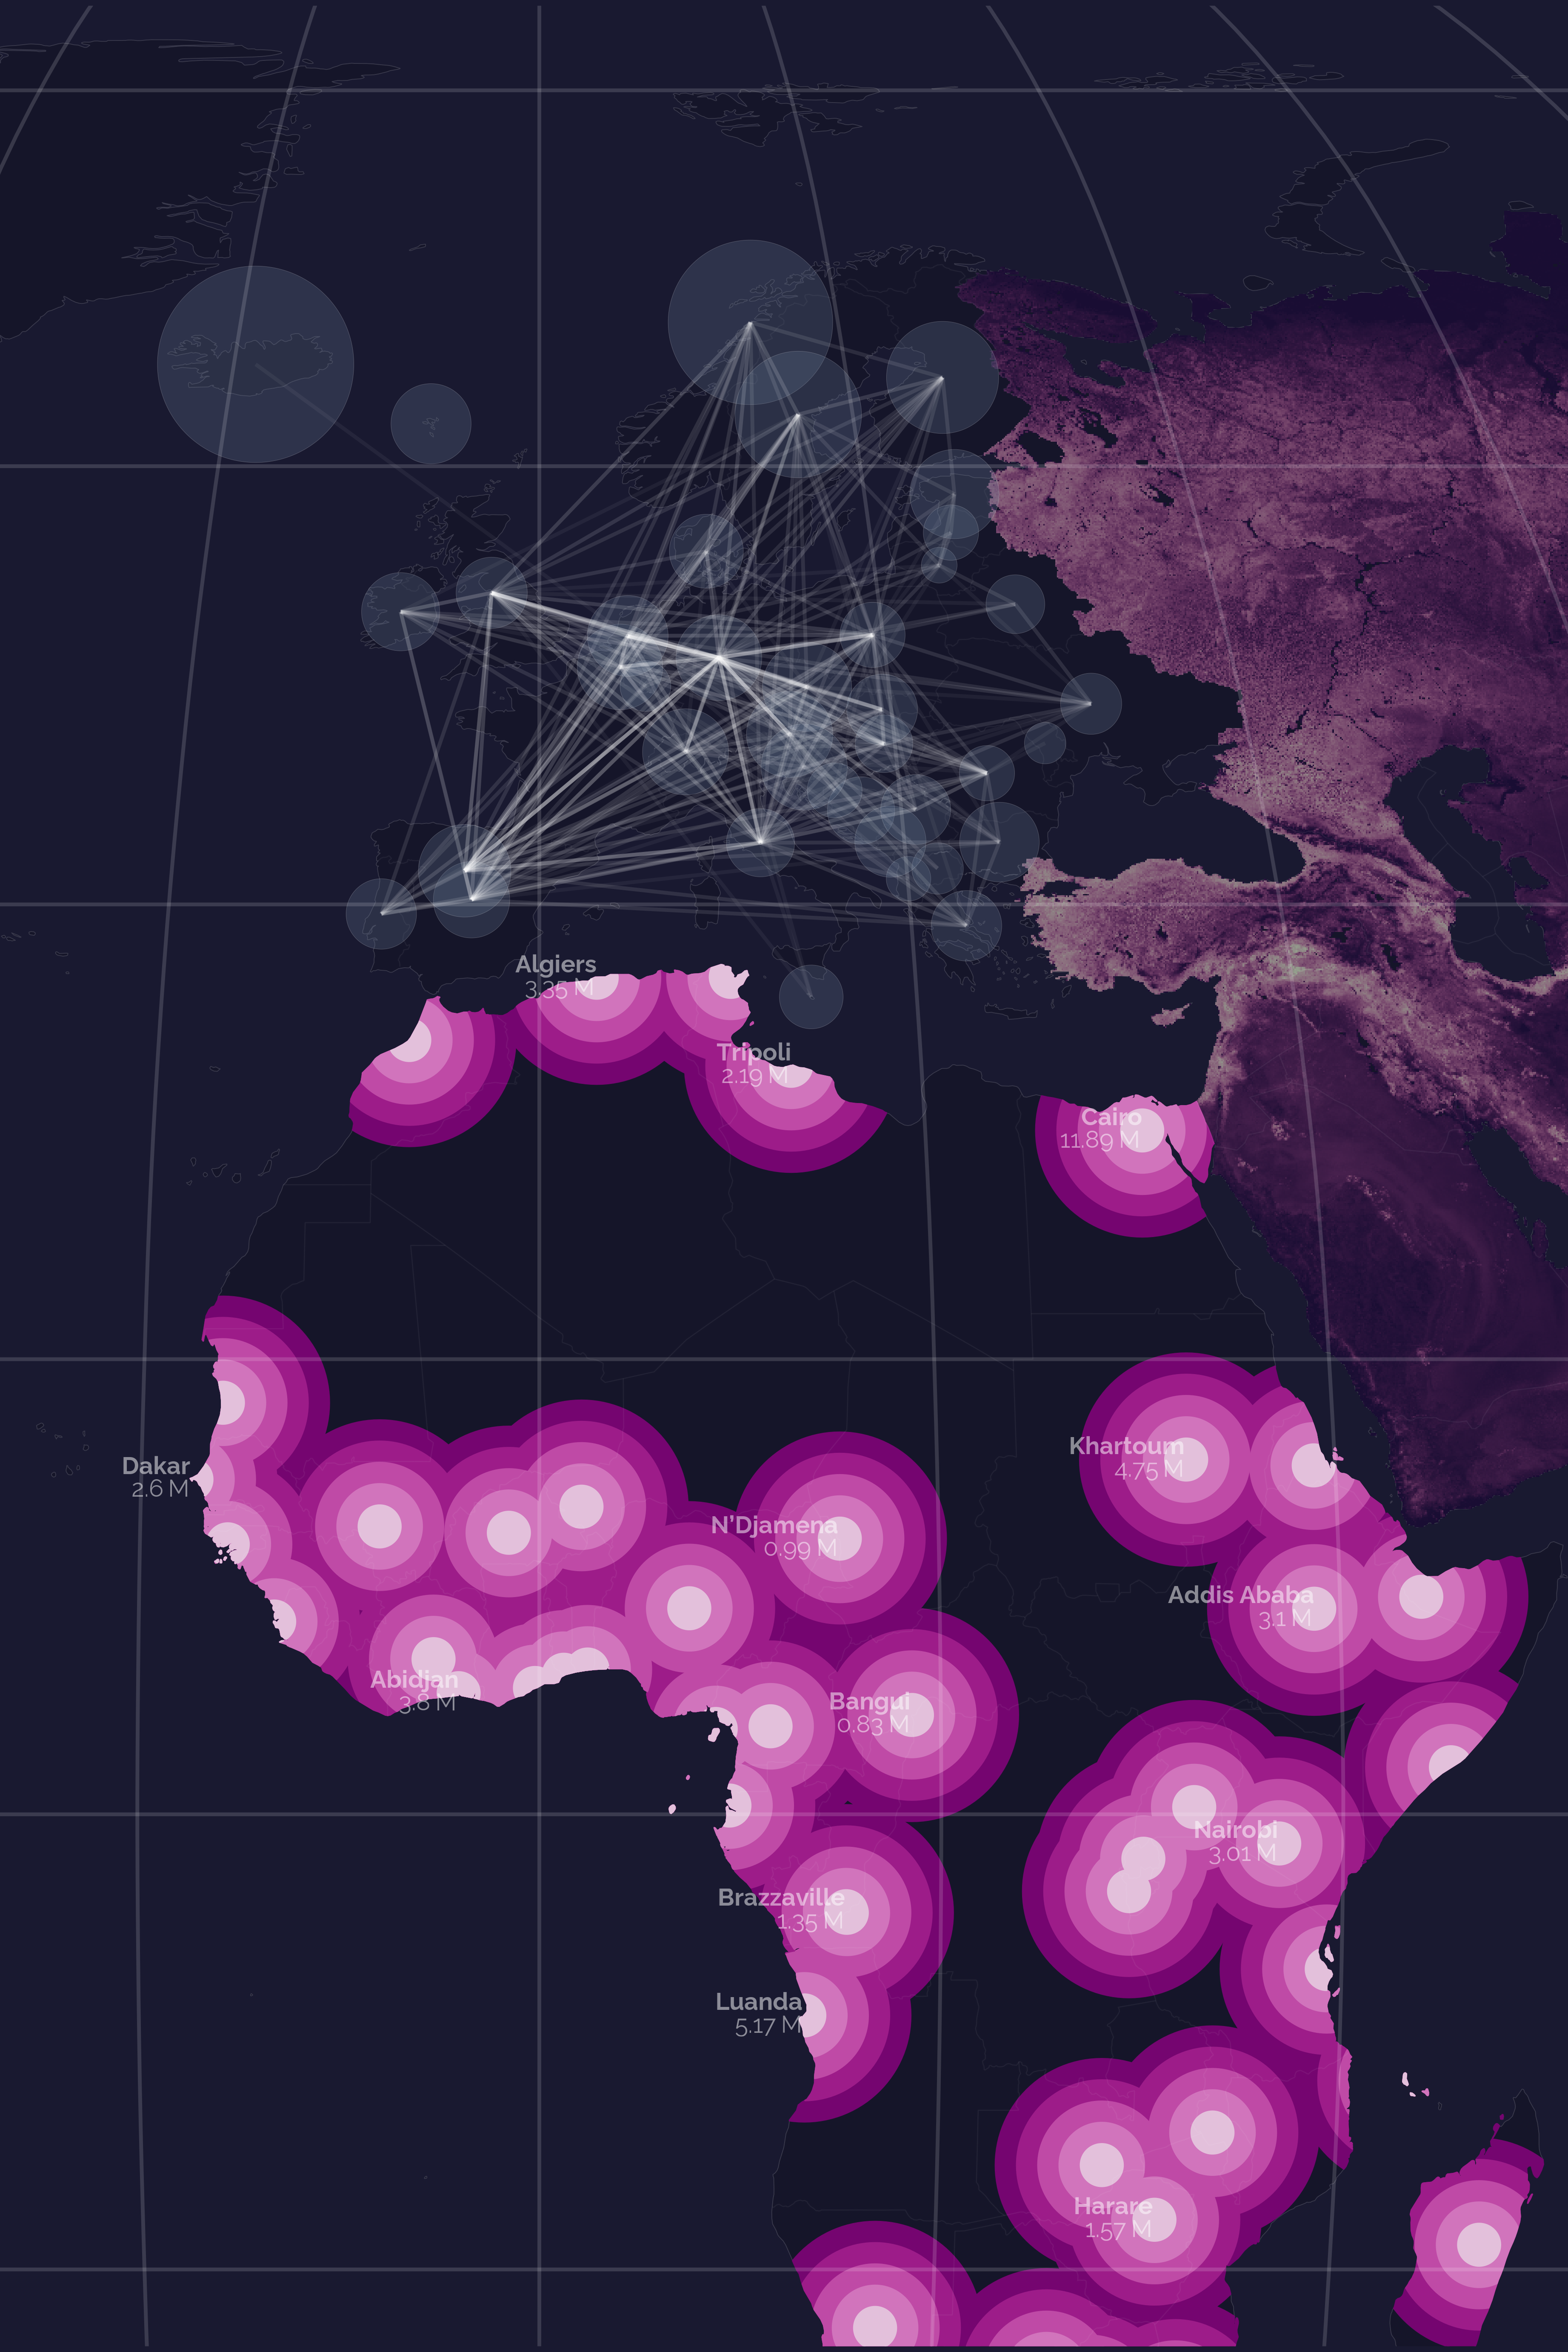
I was delighted when this proposal was chosen by Robin, Jakub and Jannes for the cover of the second edition of Geocomputation with R! But there were still a few elements missing to illustrate the diversity of cartographic objects and methods covered in the book. So, after some discussion and several iterations with the authors, we added:
- a NDVI raster covering the eastern part of the map
- a map of trades over Europe
On this last point, I had already had the opportunity to transform the FAOStat tables of coffee exports into line vectors, but I have to admit that the solution provided here by Robin, with the od package, was much faster! After one last try, a solution was found to keep a version of Dorling’s cartogram in the background, by keeping the circles on the centroids (which leads to superimpositions but is more consistent with the departures and arrivals of the flows).
Now, the image contains vector and raster data (which is the focus of the 1st part of the book), shows some visualization techniques (i.e., cartograms; 2nd part of the book), and also shows some geocomputation techniques (i.e., origin-destination lines; 3rd part of the book).

Overall, I enjoyed creating this cover, and even more so with the exchanges with the authors and the iterations that led to the final version of the cover. Many thanks to Robin, Jakub and Jannes for allowing me to make a small contribution to this great project!
Reuse
Citation
@online{nowak2024,
  author = {Nowak, Benjamin},
  title = {Geocomputation with {R} Competition: Book Cover for the 2nd
    Edition},
  date = {2024-01-17},
  url = {https://geocompx.org/post/2024/cover-competition-results/},
  langid = {en}
}